nvim-dap — Getting started
nvim-dap implements a client for the Debug Adapter Protocol. This allows a client to control a debugger over a documented API. That allows us to control the debugger from inside neovim, being able to set breakpoints, evaluate runtime values of variables, and much more.
We’ll work through setting up nvim-dap. It is expected your debugger is
installed and accessible from a terminal. Some documented installation of
popular debuggers is available on the nvim-dap
Debug-Adapter-Installation
On the Debug-Adapter-Installation you will also find configurations for associated languages. nvim-dap is not configured for any language by default. You will need to set up a configuration for each language. For the configurations you will need adapters to run.
I recommend using the adapters and configurations from these to start. Put these in your Neovim config.
require("dap").adapters.lldb = {
	type = "executable",
	command = "/usr/bin/lldb-vscode", -- adjust as needed
	name = "lldb",
}

local lldb = {
	name = "Launch lldb",
	type = "lldb", -- matches the adapter
	request = "launch", -- could also attach to a currently running process
	program = function()
		return vim.fn.input(
			"Path to executable: ",
			vim.fn.getcwd() .. "/",
			"file"
		)
	end,
	cwd = "${workspaceFolder}",
	stopOnEntry = false,
	args = {},
	runInTerminal = false,
}

require('dap').configurations.rust = {
	lldb -- different debuggers or more configurations can be used here
}
I recommend making some variables for the configurations as the language could be a few. For example with Typescript/react where you may have 4 different “filetypes” using the same language.
Again, by default nvim-dap does not do anything. Does not set up key mappings. But that’s good as you can set up the key mappings that work for you.
:help dap-mappings gives you some example mappings for you to use.
nnoremap <silent> <F5> <Cmd>lua require'dap'.continue()<CR>
nnoremap <silent> <F10> <Cmd>lua require'dap'.step_over()<CR>
nnoremap <silent> <F11> <Cmd>lua require'dap'.step_into()<CR>
nnoremap <silent> <F12> <Cmd>lua require'dap'.step_out()<CR>
nnoremap <silent> <Leader>b <Cmd>lua require'dap'.toggle_breakpoint()<CR>
nnoremap <silent> <Leader>B <Cmd>lua require'dap'.set_breakpoint(vim.fn.input('Breakpoint condition: '))<CR>
nnoremap <silent> <Leader>lp <Cmd>lua require'dap'.set_breakpoint(nil, nil, vim.fn.input('Log point message: '))<CR>
nnoremap <silent> <Leader>dr <Cmd>lua require'dap'.repl.open()<CR>
nnoremap <silent> <Leader>dl <Cmd>lua require'dap'.run_last()<CR>
Or in the new Lua interface.
local n = "n"
vim.keymap.set(n, '<leader>dk', function() require('dap').continue() end)
vim.keymap.set(n, '<leader>dl', function() require('dap').run_last() end)
vim.keymap.set(n, '<leader>b', function() require('dap').toggle_breakpoint() end)
I would suggest starting with 2 actions. Setting breakpoints and “running” the debugger. The debugger allows us to stop execution and look at the current state of the program. Setting breakpoints will allow us to stop execution and see what the current state is.
Go to a line where a conditional or value is set and toggle a breakpoint.
:lua require('dap').toggle_breakpoint()
Setting to the correct line will make sure the breakpoints get hit.
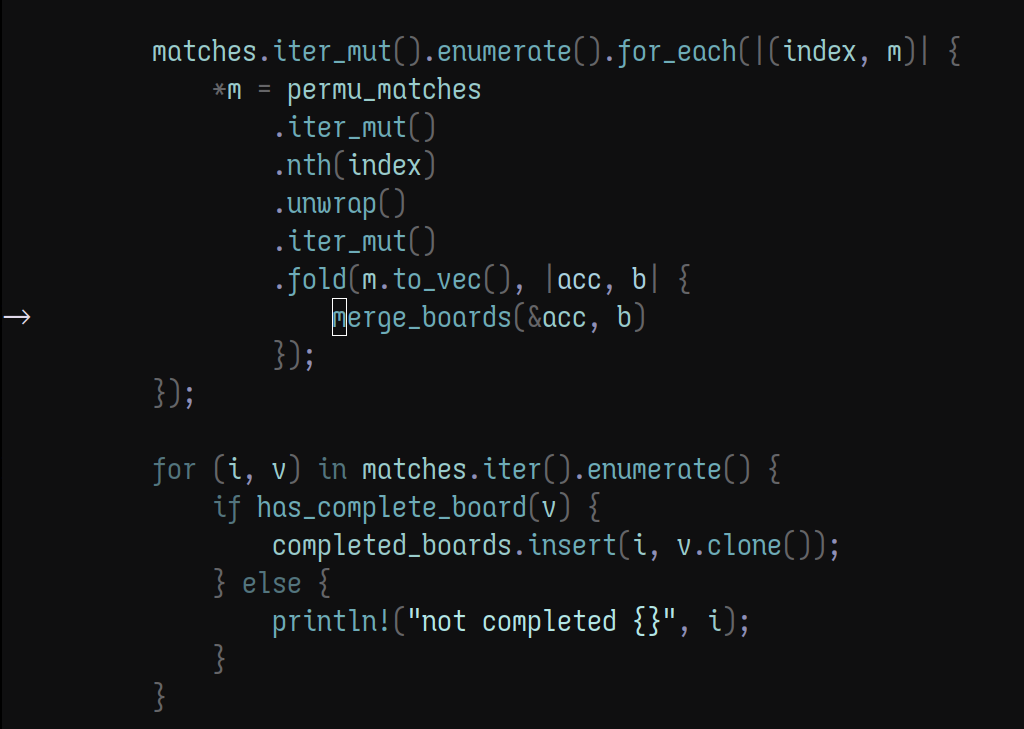
Then, we’ll start the debugger. If done correctly, you’ll see an arrow next to your line of code you set a breakpoint at.
Ok. Now you may be asking… “that’s it?. What about all the cool stuff with evaluating variables and seeing what the current state is. Is there no UI? Where is all the cool stuff my (insert debugger here) does?“
That’s right, there is no UI with dap by default. You have a few options for UI, with more possibilities in the future.
DAP UI Plugins
nvim-dap-virtual-text
nvim-dap-virtual-text puts the variable values into the virtual next that is at the end of a line of code. This can make it easy to see the values set and also what has changed inline. Downside is it can be hard to read for some languages with values being more complex.
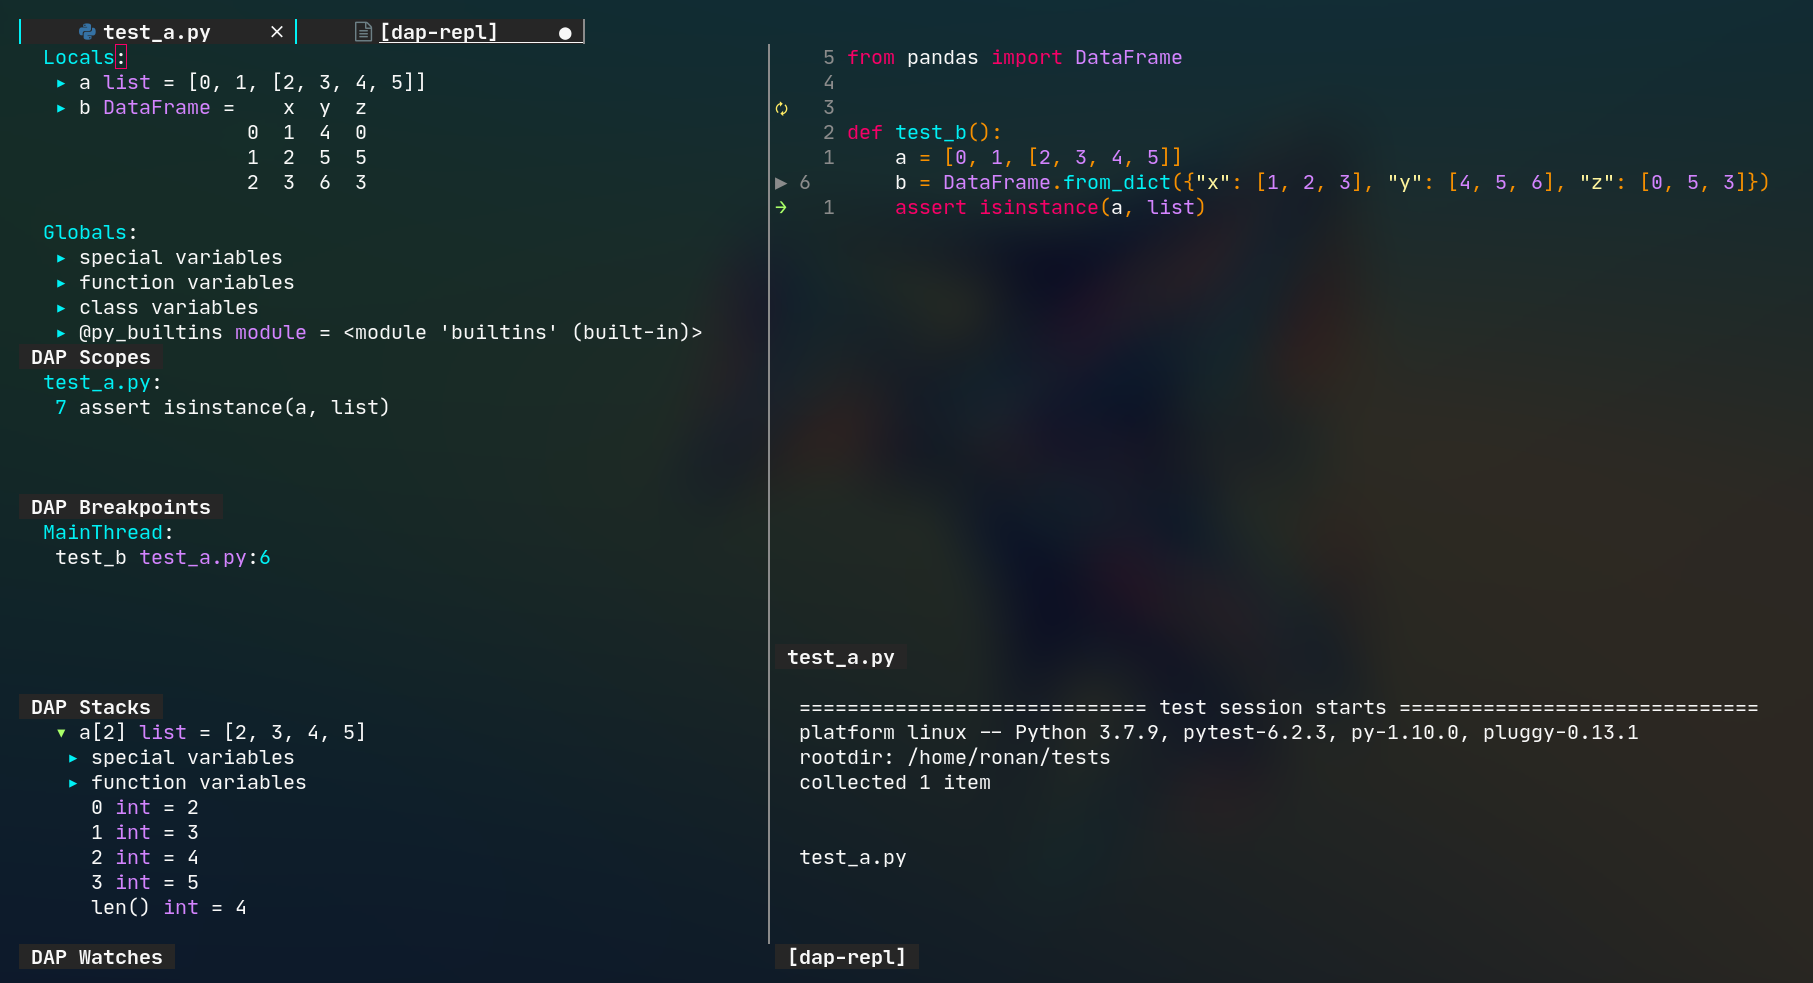
nvim-dap-ui
nvim-dap-ui gives an out-of-the-box experience. Hooking is
configureable to starting and stopping the debugger. Key mappings for toggling,
with a customization of what panes show and creating different views. This
plugin may be information overload to start though but the recommended choice
for UI. Again does not do anything by default, you must turn on the UI.
nvim-dap experimental UI
nvim-dap also comes with a simple UI for some things. It’s more bare bones and requires you to compose a UI together, but this allows you to create your own interactions. I created a small variable evaluator widget for inspecting single values.
See :help dap-widgets for more info.
Typical workflow for nvim-dap
My usual workflow can sometimes start with a third-party plugin like rust-tools.nvim or jester, which allow me to interact with the debugger starting through them. These plugins can help to configure when and where to start when running things like tests. I find myself wanting to run debugger for tests to limit the amount of code that might interact and be able to step around with the debugger, seeing the code where I would usually see it.
Simply you will need to start your application in some way and attach the debugger to it. DAP allows you to start and attach directly. To start you’d usually be at:
:lua require('dap').continue()
If you are running short tests, you should put in your breakpoints first. Then toggle open a UI to see what some values are, simply evaluate things with the virtual text and use different key mappings to evaluate.
Progression
Learning more tricks about using a debugger can expand from here. If you spend a lot of time doing print debugging and finding it hard to keep track of things that happen a lot of times, using a debugger can help slow things down to evaluate against. Progressing to using a debugger easily is a good way to get into a practice of using it. Slowly build up a workflow that works for you.